
在没有部署prometheus服务之前,我们需要知道,prometheus是一个监控工具,prometheus自带有一个TDSDB存储抓取的监控数据。不需要docker或者Kubernetes推送,prometheus默认没有报警功能需要安装。下面先看看prometheus是如何安装的吧。
prometheus安装
首先,根据自己的需求,选择合适的版本,我安装的是2.4.3版本,已经把文件下载完了,如果安装其他版本可以参考:https://prometheus.io/download/
[root@www.wulaoer.org ~]# tar -zxf prometheus-2.4.3.linux-amd64.tar.gz
[root@www.wulaoer.org ~]# cd prometheus-2.4.3.linux-amd64
配置prometheus
单机安装,不需要配置任何信息,先看一下配置信息,下面是默认配置信息:
[root@www.wulaoer.org prometheus-2.4.3.linux-amd64]# vim prometheus.yml
# my global config
global:
  scrape_interval:     15s # Set the scrape interval to every 15 seconds. Default is every 1 minute.
  evaluation_interval: 15s # Evaluate rules every 15 seconds. The default is every 1 minute.
  # scrape_timeout is set to the global default (10s).

# Alertmanager configuration
alerting:
  alertmanagers:
  - static_configs:
    - targets:
      # - alertmanager:9093

# Load rules once and periodically evaluate them according to the global 'evaluation_interval'.
rule_files:
  # - "first_rules.yml"
  # - "second_rules.yml"

# A scrape configuration containing exactly one endpoint to scrape:
# Here it's Prometheus itself.
scrape_configs:
  # The job name is added as a label `job=<job_name>` to any timeseries scraped from this config.
  - job_name: 'prometheus'

    # metrics_path defaults to '/metrics'
    # scheme defaults to 'http'.

    static_configs:
    - targets: ['localhost:9090']
先不需要配置,直接使用默认的即可,然后启动一下prometheus,看一下是否正常。
[root@www.wulaoer.org prometheus-2.4.3.linux-amd64]# ./prometheus
level=info ts=2020-04-28T19:46:36.844227645Z caller=main.go:238 msg="Starting Prometheus" version="(version=2.4.3, branch=HEAD, revision=167a4b4e73a8eca8df648d2d2043e21bdb9a7449)"
level=info ts=2020-04-28T19:46:36.844315243Z caller=main.go:239 build_context="(go=go1.11.1, user=root@1e42b46043e9, date=20181004-08:42:02)"
level=info ts=2020-04-28T19:46:36.84433736Z caller=main.go:240 host_details="(Linux 3.10.0-1062.el7.x86_64 #1 SMP Wed Aug 7 18:08:02 UTC 2019 x86_64 CentOS1 (none))"
level=info ts=2020-04-28T19:46:36.844355409Z caller=main.go:241 fd_limits="(soft=1024, hard=4096)"
level=info ts=2020-04-28T19:46:36.844369739Z caller=main.go:242 vm_limits="(soft=unlimited, hard=unlimited)"
level=info ts=2020-04-28T19:46:36.845237694Z caller=main.go:554 msg="Starting TSDB ..."
level=info ts=2020-04-28T19:46:36.845738951Z caller=repair.go:35 component=tsdb msg="found healthy block" mint=1588068000000 maxt=1588075200000 ulid=01E70E7DXM5B8T240BKJG35G6P
level=info ts=2020-04-28T19:46:36.845806921Z caller=repair.go:35 component=tsdb msg="found healthy block" mint=1588075200000 maxt=1588082400000 ulid=01E70MTQ5KV32C10ANPB090QF0
level=info ts=2020-04-28T19:46:36.845843838Z caller=repair.go:35 component=tsdb msg="found healthy block" mint=1588082400000 maxt=1588089600000 ulid=01E70VPMR207ADT3YFNYV7CX6N
level=info ts=2020-04-28T19:46:36.845886704Z caller=repair.go:35 component=tsdb msg="found healthy block" mint=1588089600000 maxt=1588096800000 ulid=01E712J8JXN8RG4RXZGB70F5V6
level=info ts=2020-04-28T19:46:36.847958077Z caller=web.go:397 component=web msg="Start listening for connections" address=0.0.0.0:9090
level=info ts=2020-04-28T19:46:37.189009691Z caller=main.go:564 msg="TSDB started"
level=info ts=2020-04-28T19:46:37.189089753Z caller=main.go:624 msg="Loading configuration file" filename=prometheus.yml
level=info ts=2020-04-28T19:46:37.190497805Z caller=main.go:650 msg="Completed loading of configuration file" filename=prometheus.yml
level=info ts=2020-04-28T19:46:37.190538975Z caller=main.go:523 msg="Server is ready to receive web requests."
我们使用浏览器访问一下,访问地址http://ip:9090
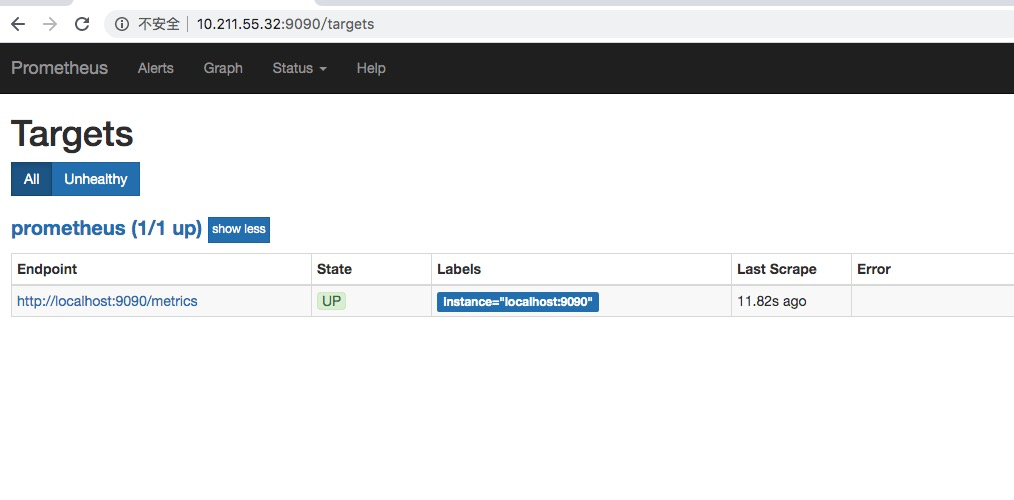
我们看一下监控信息,是否能够获取到监控的数据。
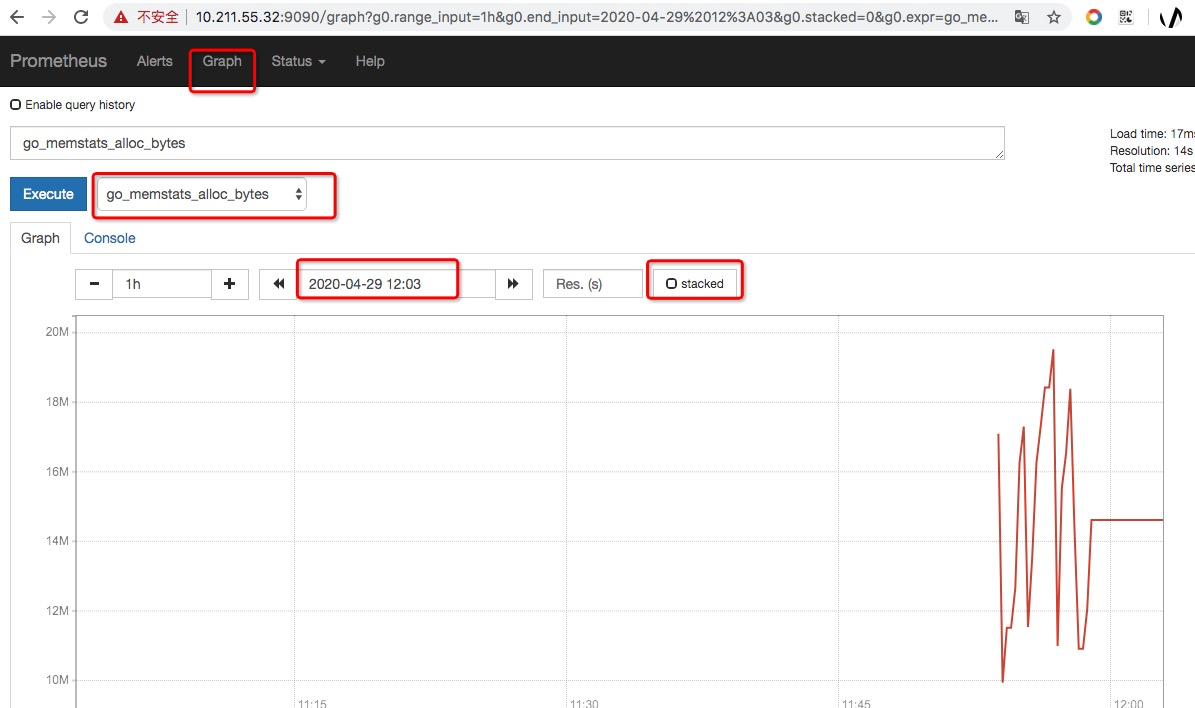
这时prometheus已经有监控数据产生了,这里的数据不适合浏览,我们可以是用grafana来展示所有的监控数据,因为grafana就是作为展示来用的。没有了看些其他的吧
您可以选择一种方式赞助本站
支付宝扫一扫赞助
微信钱包扫描赞助
赏